Orchestrator
Architecture
The SIF Orchestrator makes application service connectivity policy available to VMs and containers for immediate download anytime and anywhere they request it. Simple software programming gives the user the ability to create custom connectivity policies, allowing application services to instantiate network microsegments in strict accordance with security rules. The SIF Orchestrator enforces these policies with flow-level granularity and provides full observability for real-time policy auditing across the fabric.
The diagram below shows the architecture of the SIF Orchestrator in default deployment mode.
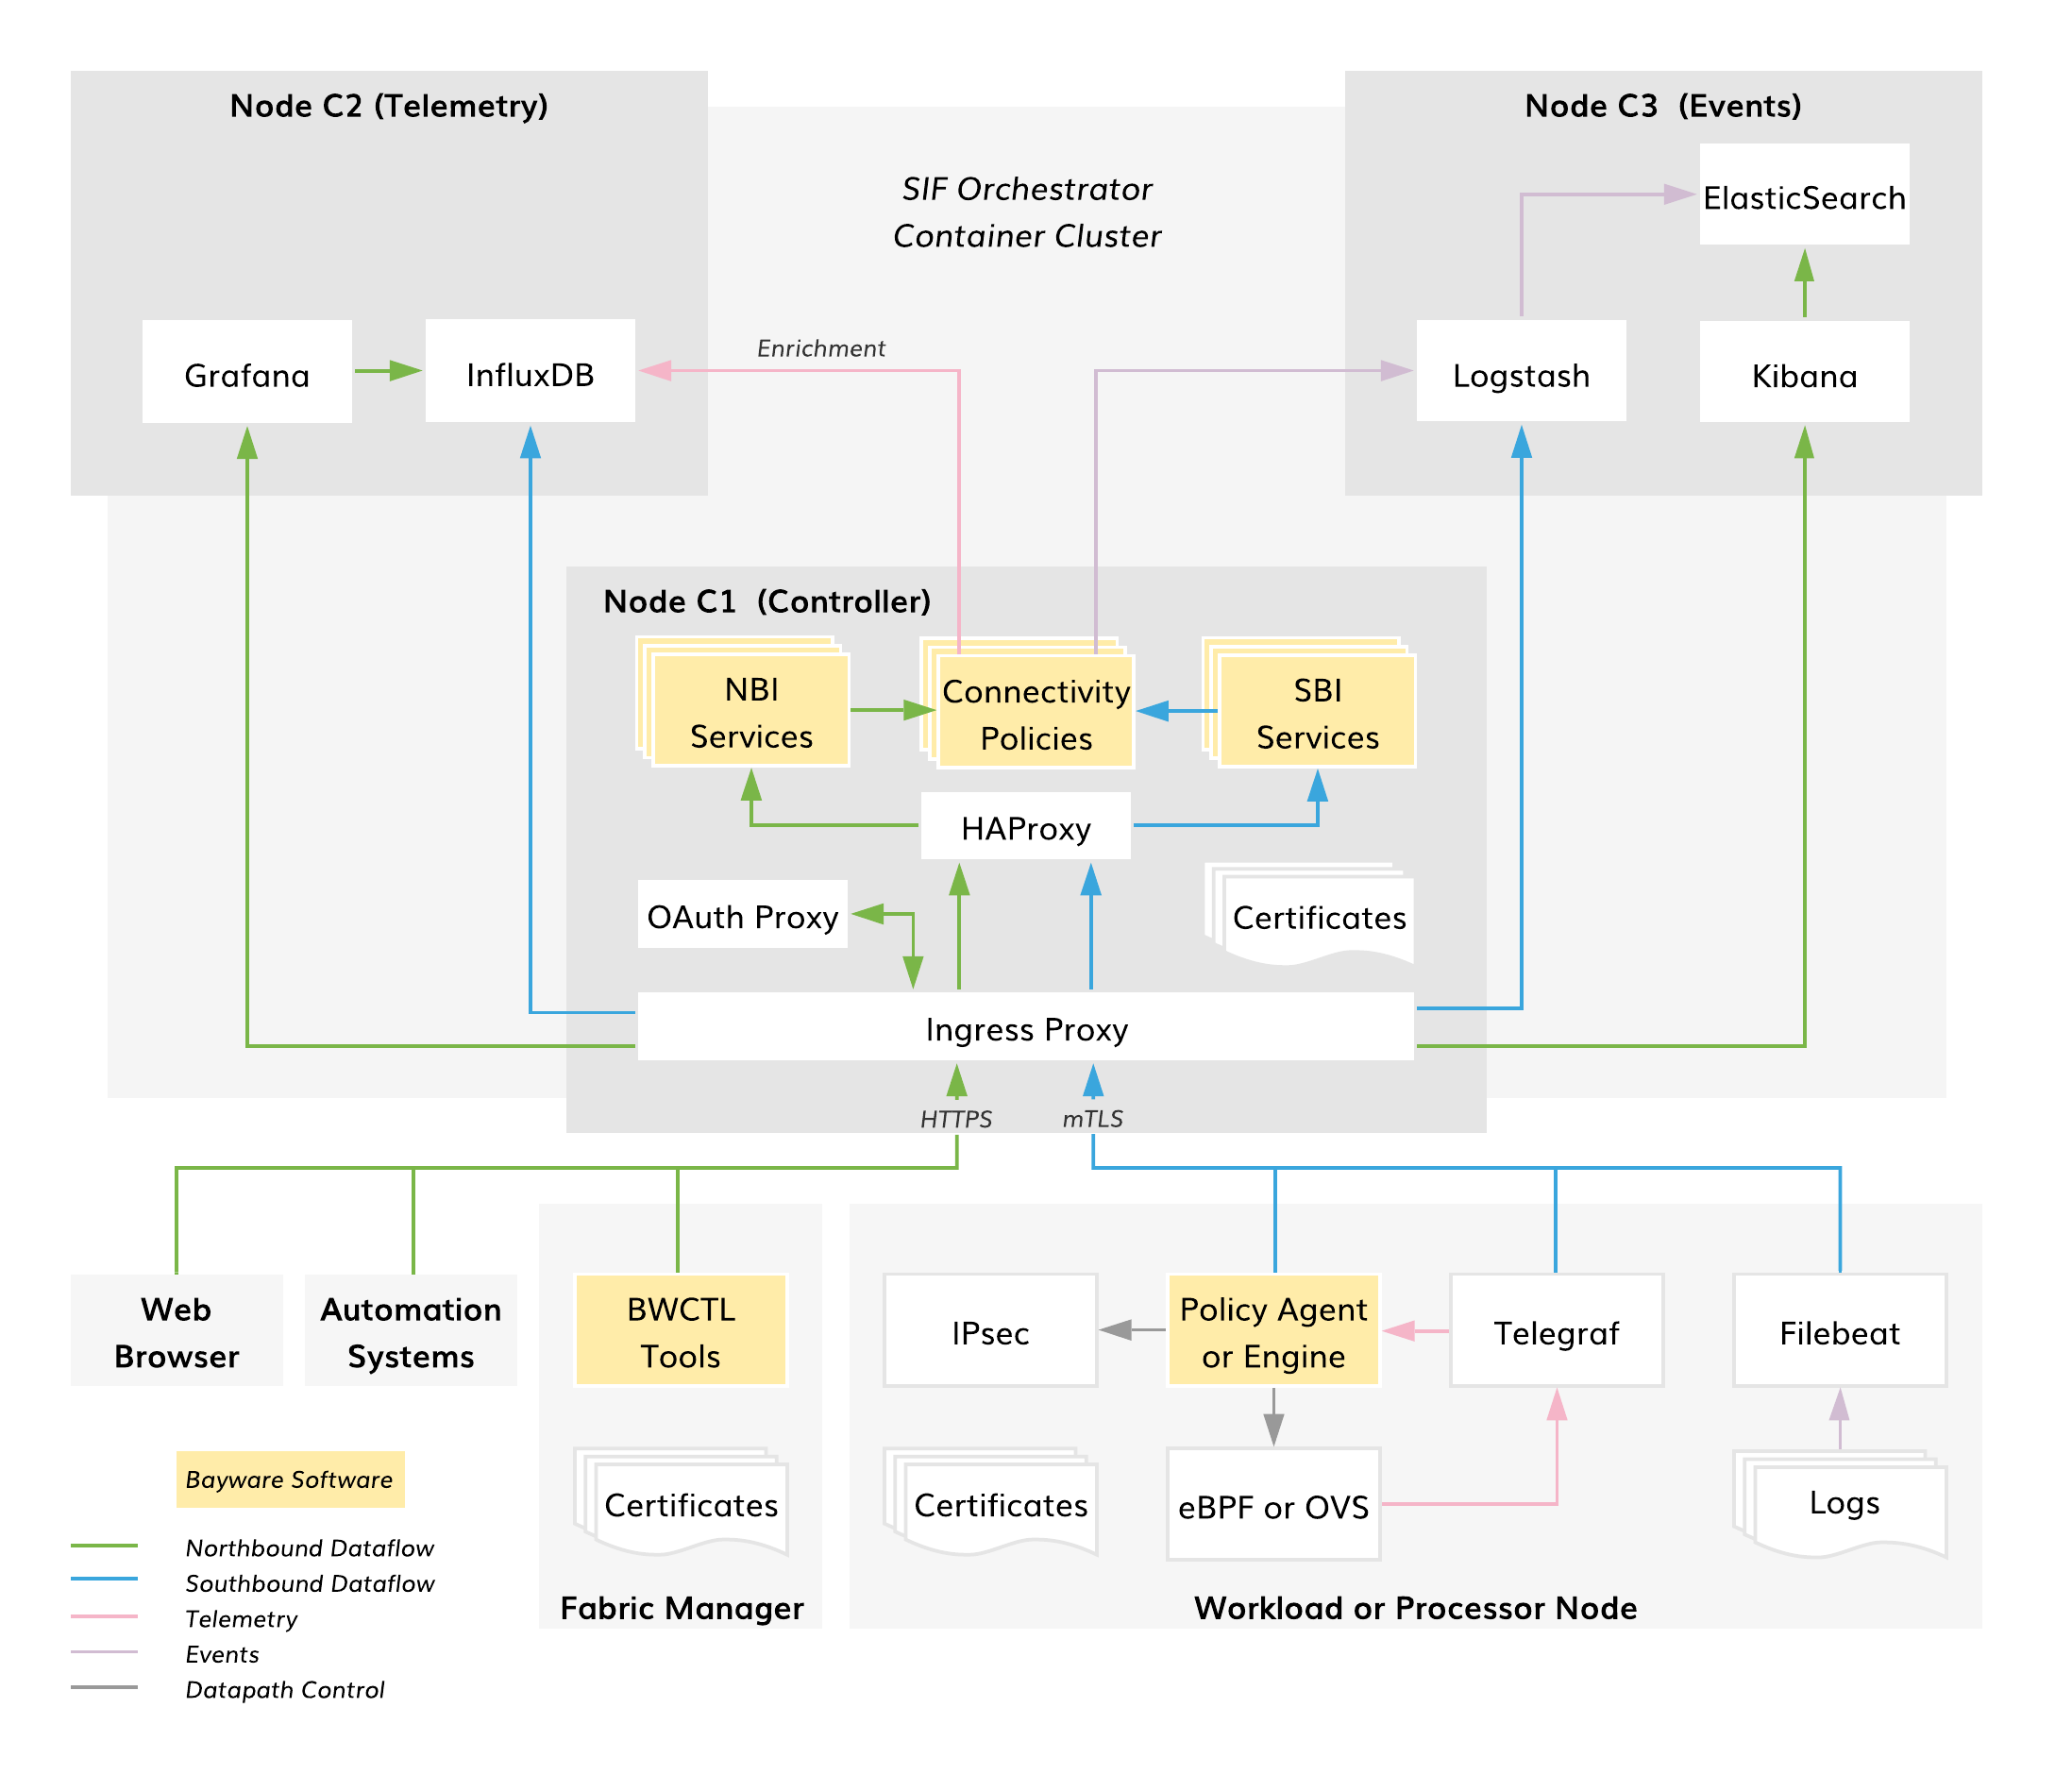
Fig. 105 SIF Orchestrator Architecture
The SIF Orchestrator is implemented as a container cluster and typically, consists of three nodes:
- Controller – connectivity policy management
- Telemetry – compute and network statistics
- Events – log processing
The Orchestrator RESTful northbound interface (NBI) allows third-party automation systems to manage all resource and service connectivity policies in the fabric. The Fabric Manager itself utilizes this same interface for policy management. The NBI also facilitates communication with the orchestrator when using a web browser to control policy or access telemetry and log data. The northbound interface is secured with a Let’s Encrypt certificate, OAuth2.0 authorization, and OpenID Connect authentication.
The Orchestrator’s southbound interface (SBI) enforces the resource and service connectivity policies on all workload and processor nodes in the fabric. The SBI supplies workload Policy Agents with service connectivity policy and processor Policy Engines with resource connectivity policy. Additionally, telemetry and log agents ship data to the Orchestrator from fabric nodes using this interface. All SBI operations are fully automated and secured with mTLS.
Controller
The controller services are the only mandatory components of the orchestrator. They comprise four functional sets:
- Proxy services – ingress, OAuth, and high-availability proxies
- NBI services – northbound interface support
- SBI services – southbound interface support
- Connectivity Policy services – resource and service policy management
As shown in the diagram below, connectivity policy management logically consists of the following functional blocks: administration, service configuration, resource configuration, and operation.
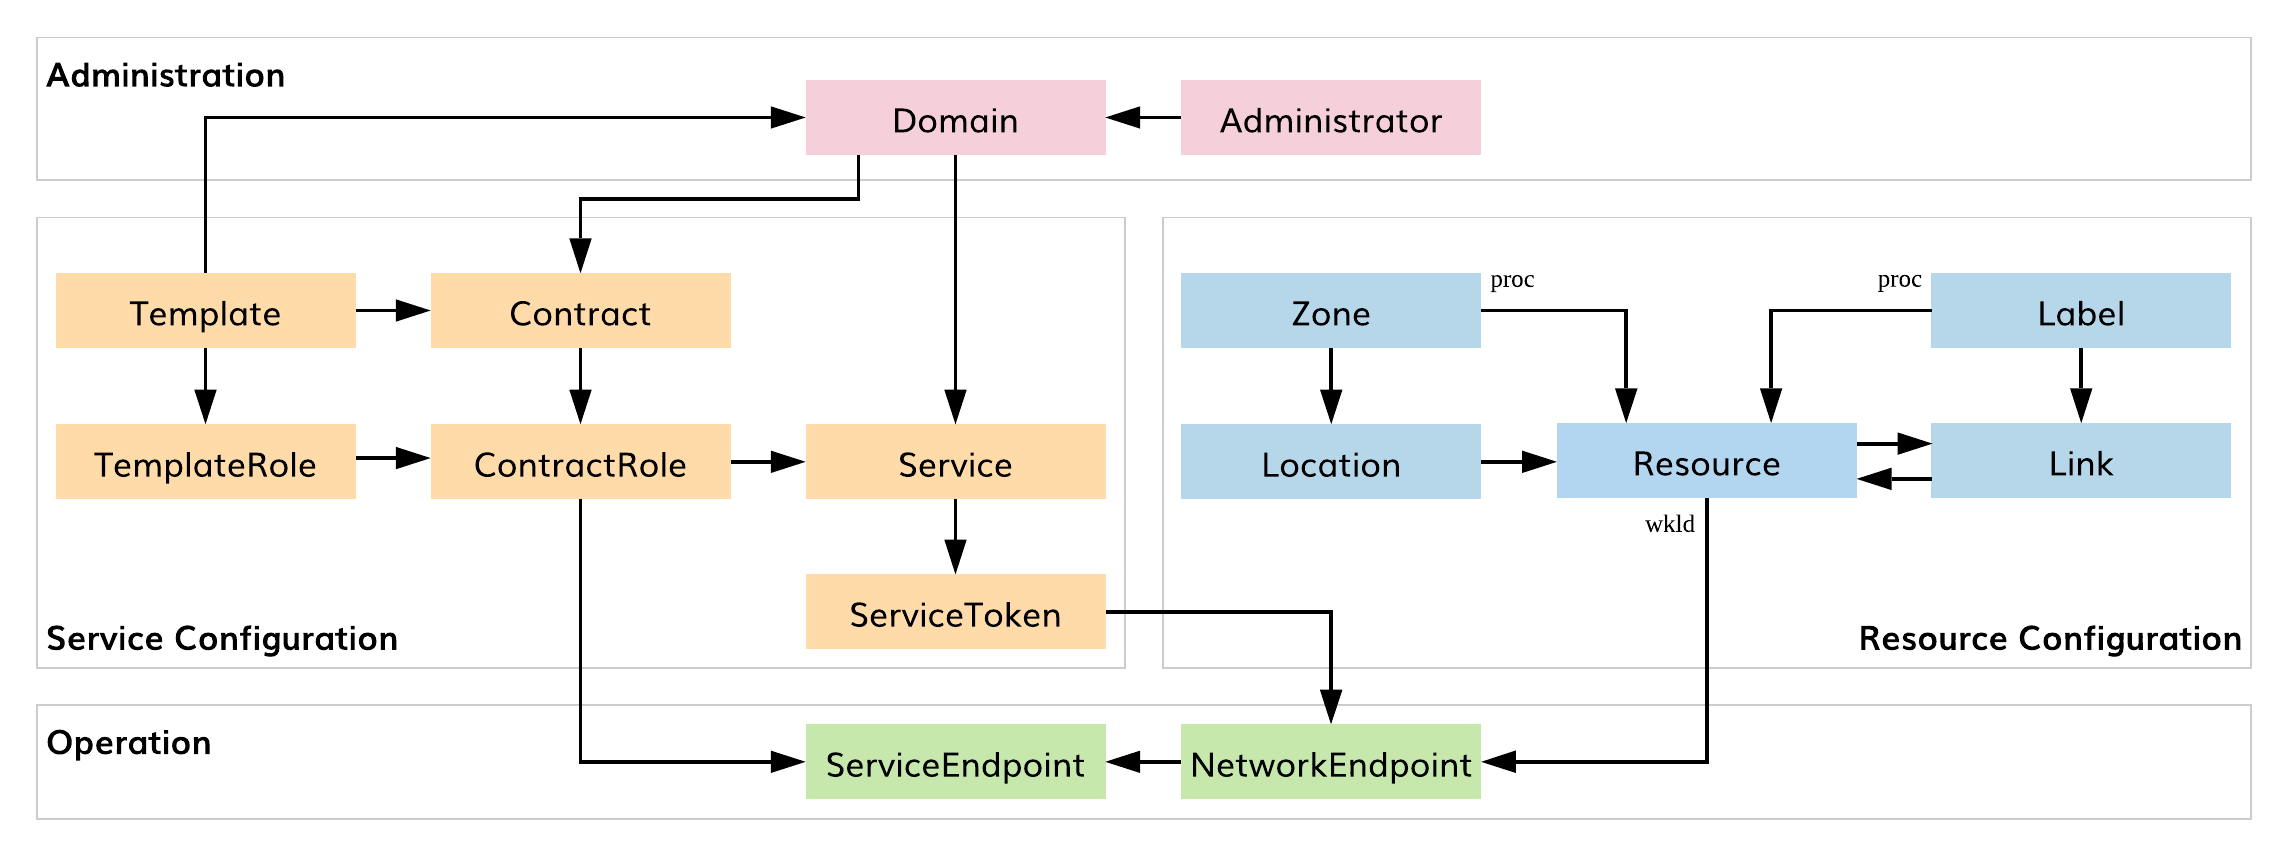
Fig. 106 SIF Connectivity Policy Entities
The Administration block allows the user to manage administrators and namespaces for application deployment (i.e., domains). Service and Resource Configuration blocks provide service and resource graph management, respectively. The Operation block automatically enforces connectivity policies on service and network endpoints.
A service graph depicts service policy configuration on the controller. The screenshot below shows an example.
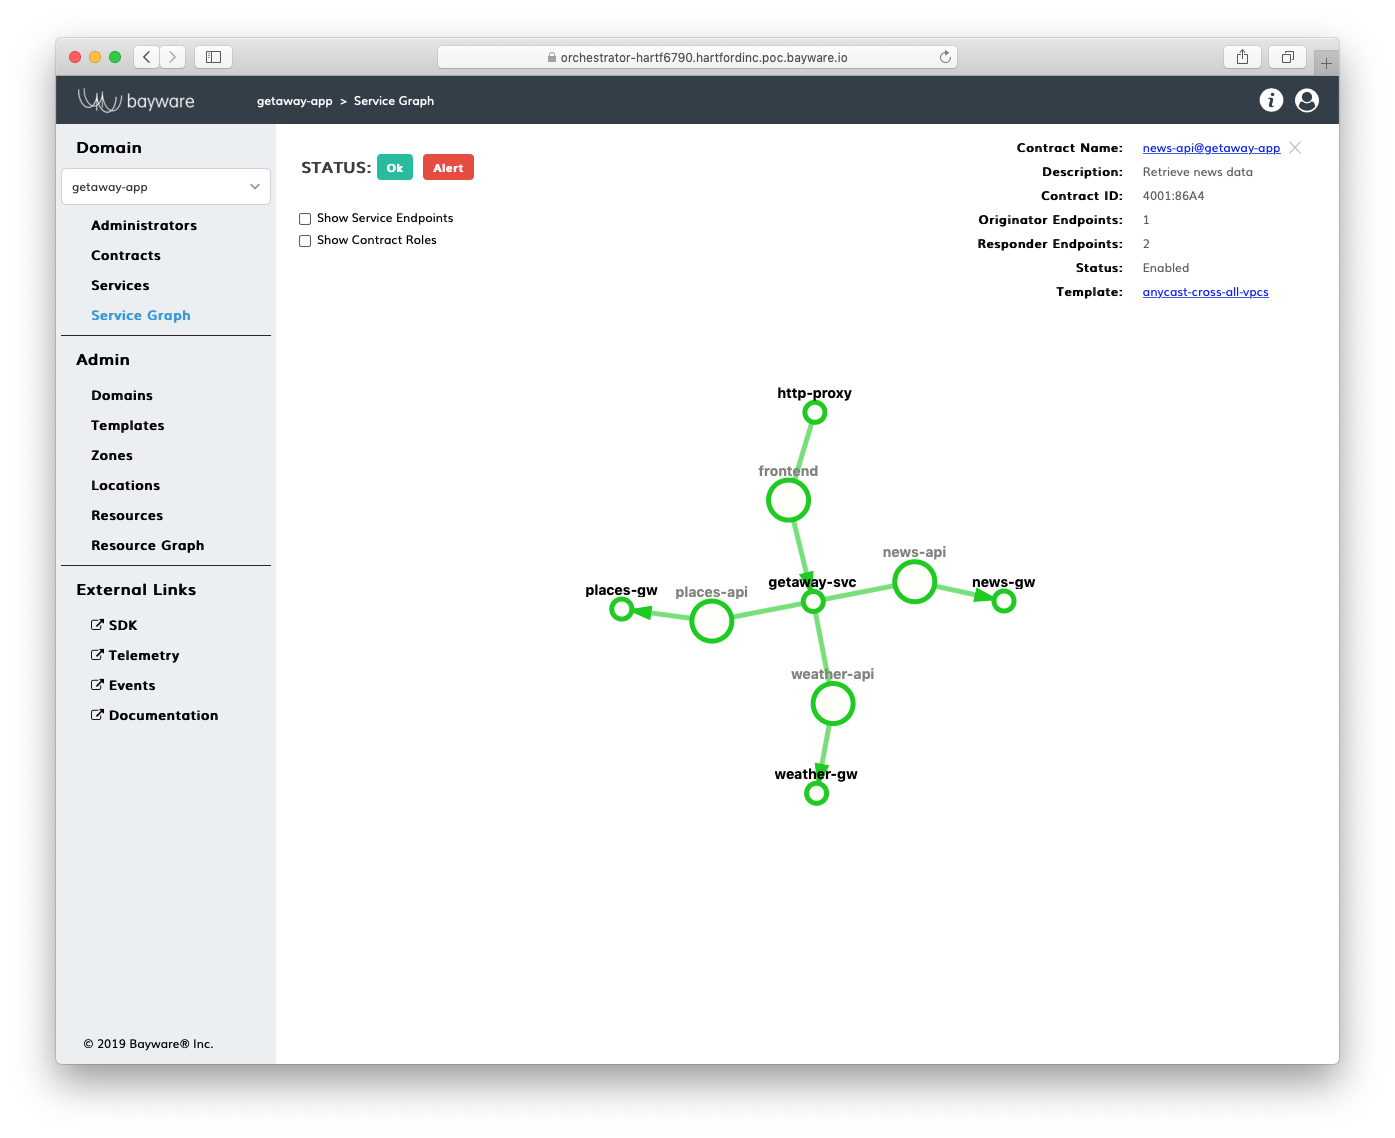
Fig. 107 Service Graph
The small circles on the graph represent an application service, while the large circles on the graph represent an application contract. The latter defines the relationship between application services. A contract inherits all essential communication rules from a template but allows for customization. A service acquires a contract role and can communicate with opposite-role services within the same contract. To set up a service endpoint, each service must possess a service token. The service applies the service token to a network endpoint on a VM or Kubernetes worker node (i.e., workload node) during service instance deployment. During initialization, the service endpoint automatically retrieves settings from the corresponding contract role specification on the controller and activates a dedicated service discovery process in the fabric.
A resource graph depicts resource policy configuration on the controller. The screenshot below shows an example.
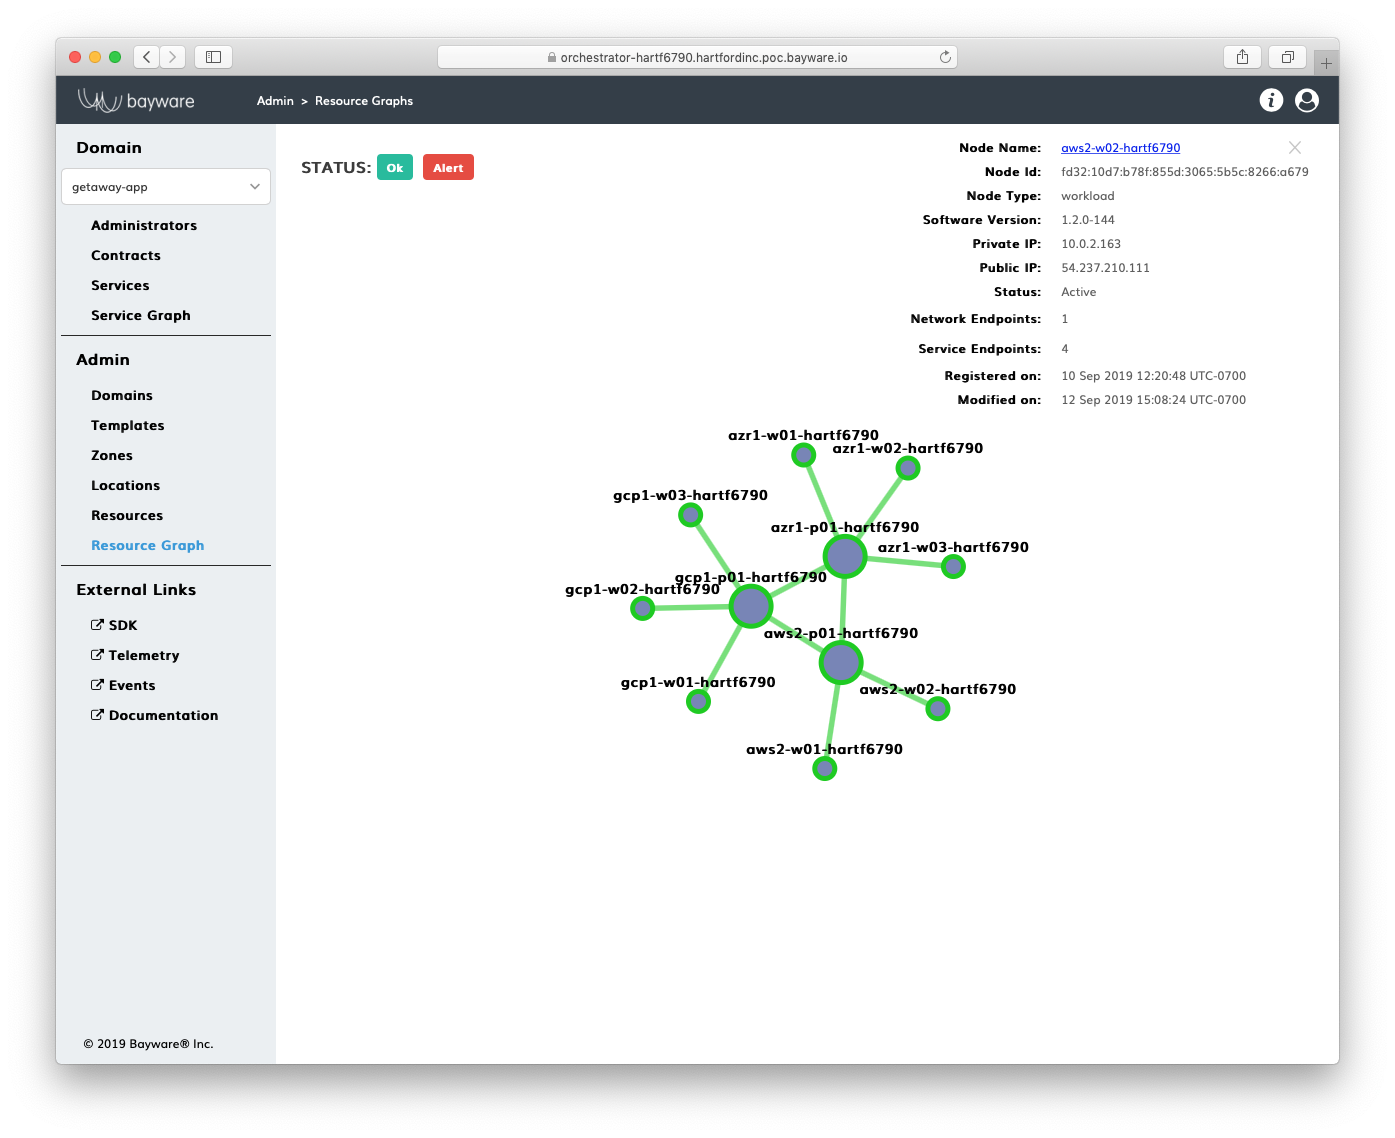
Fig. 108 Resource Graph
The small circles on the graph represent workload nodes, while the large circles show processor nodes. Workloads and processors are called resources in the SIF Policy Entities data model. Workloads provide application services with network endpoints. Processors work as secure transit gateways for workloads. A security zone abstraction allows the user to assign a processor to serve a set of workloads in a given location. When a workload in a given location comes up, a logical link automatically attaches the workload to a zone processor. Link and processor labels allow the user to mark pathways for application service discovery packets in the fabric. By processing labels, these packets may instantly change routes in order to lower infrastructure cost, balance compute load, and facilitate application scaling.
Telemetry
Telemetry services are optional components of the orchestrator. When installed, they automatically collect and process the following statistics:
- Orchestrator telemetry
- System: CPU, memory, disk, network interface
- Processor telemetry
- System: CPU, memory, disk, network interface
- Link: packet loss, response time, encryption, link utilization
- Workload telemetry
- System: CPU, memory, disk, and network interface
- Service: packet loss, response time, endpoint utilization
- Flow telemetry
- Packets: contract, source, destination, transit points, protocol, port, total size
The screenshot below illustrates a processor telemetry dashboard (more examples are in the Telemetry section of the Deploying a Geo-Redundant App tutorial).
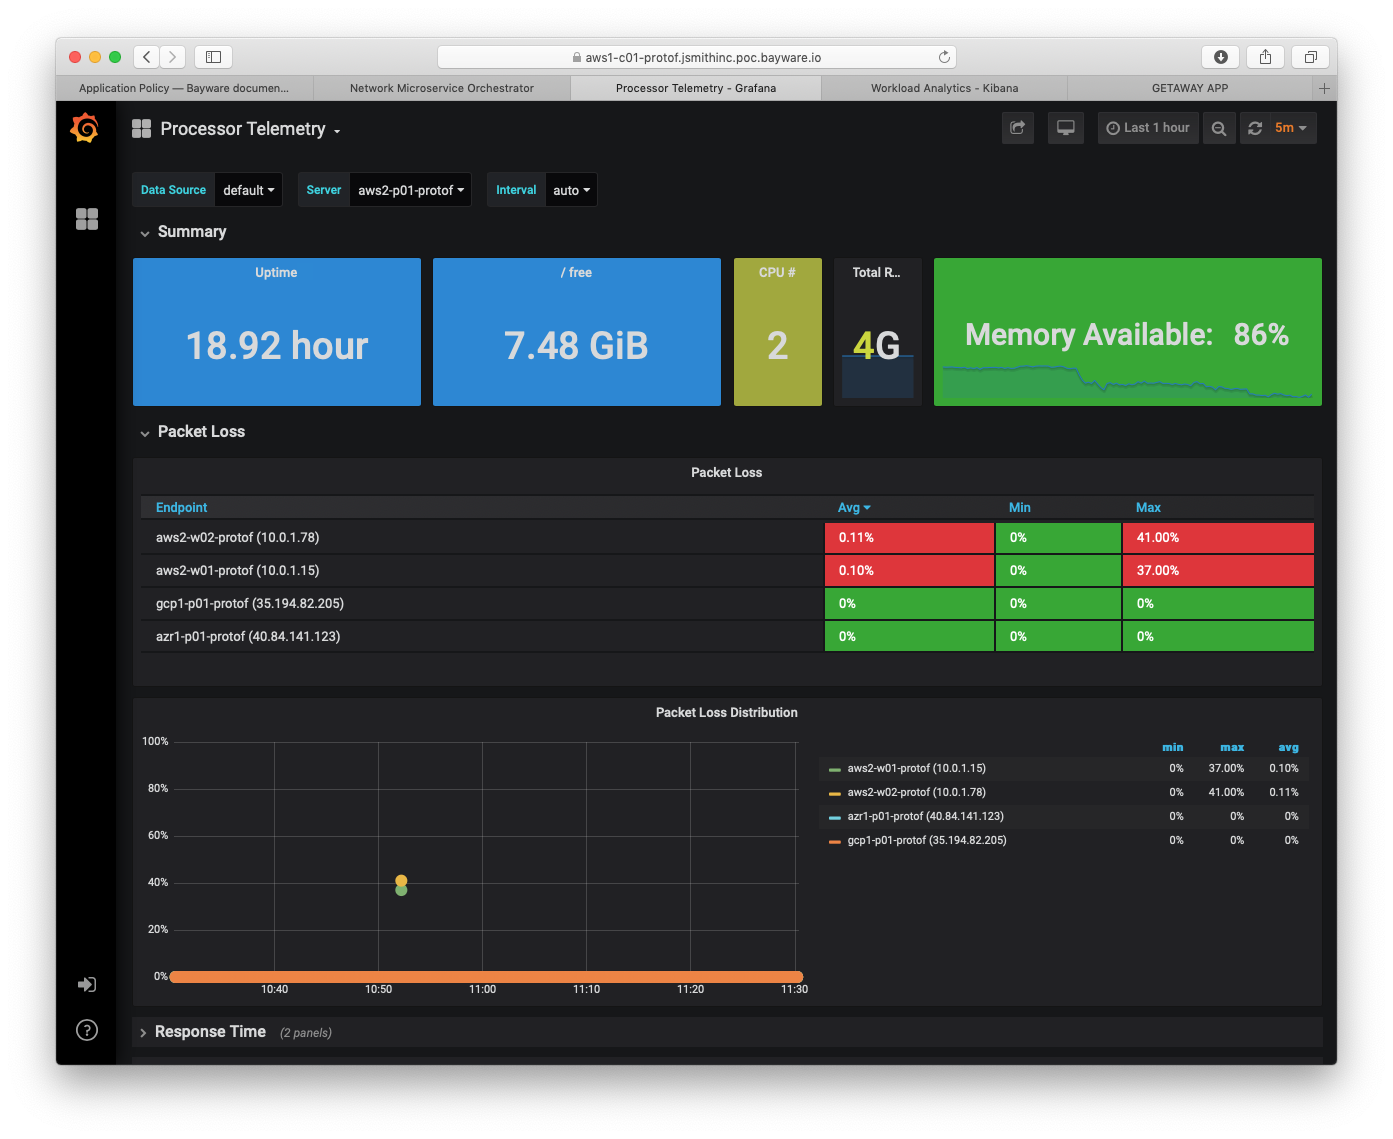
Fig. 109 Processor Telemetry – Packet Loss
A telemetry agent on each node collects statistics from all local sources and sends them to the orchestrator in an encrypted mTLS channel. Tightly integrated with the processor and workload software, the agent is able to automatically discover new links, service endpoints, and flows and process them as telemetry sources. Near-real-time background telemetry enrichment makes the statistics, provided by the agent, easy to interpret and correlate on the orchestrator.
In summary, the orchestrator telemetry services are available out-of-the-box. They provide the user with unique data on application connectivity health from multiple perspectives. The service setup and operation require neither manual provisioning nor configuration. Moreover, automatic authentication and total encryption allow telemetry data to be securely routed in a multicloud environment.
Events
Events services are also optional components of the orchestrator. When installed, they automatically collect and process the following logs:
- System;
- Encryption (IPsec);
- Datapath (eBPF, OVS);
- Policy Agent and Engine;
- Policy Controller.
The screenshot below illustrates a default workload analytics dashboard.
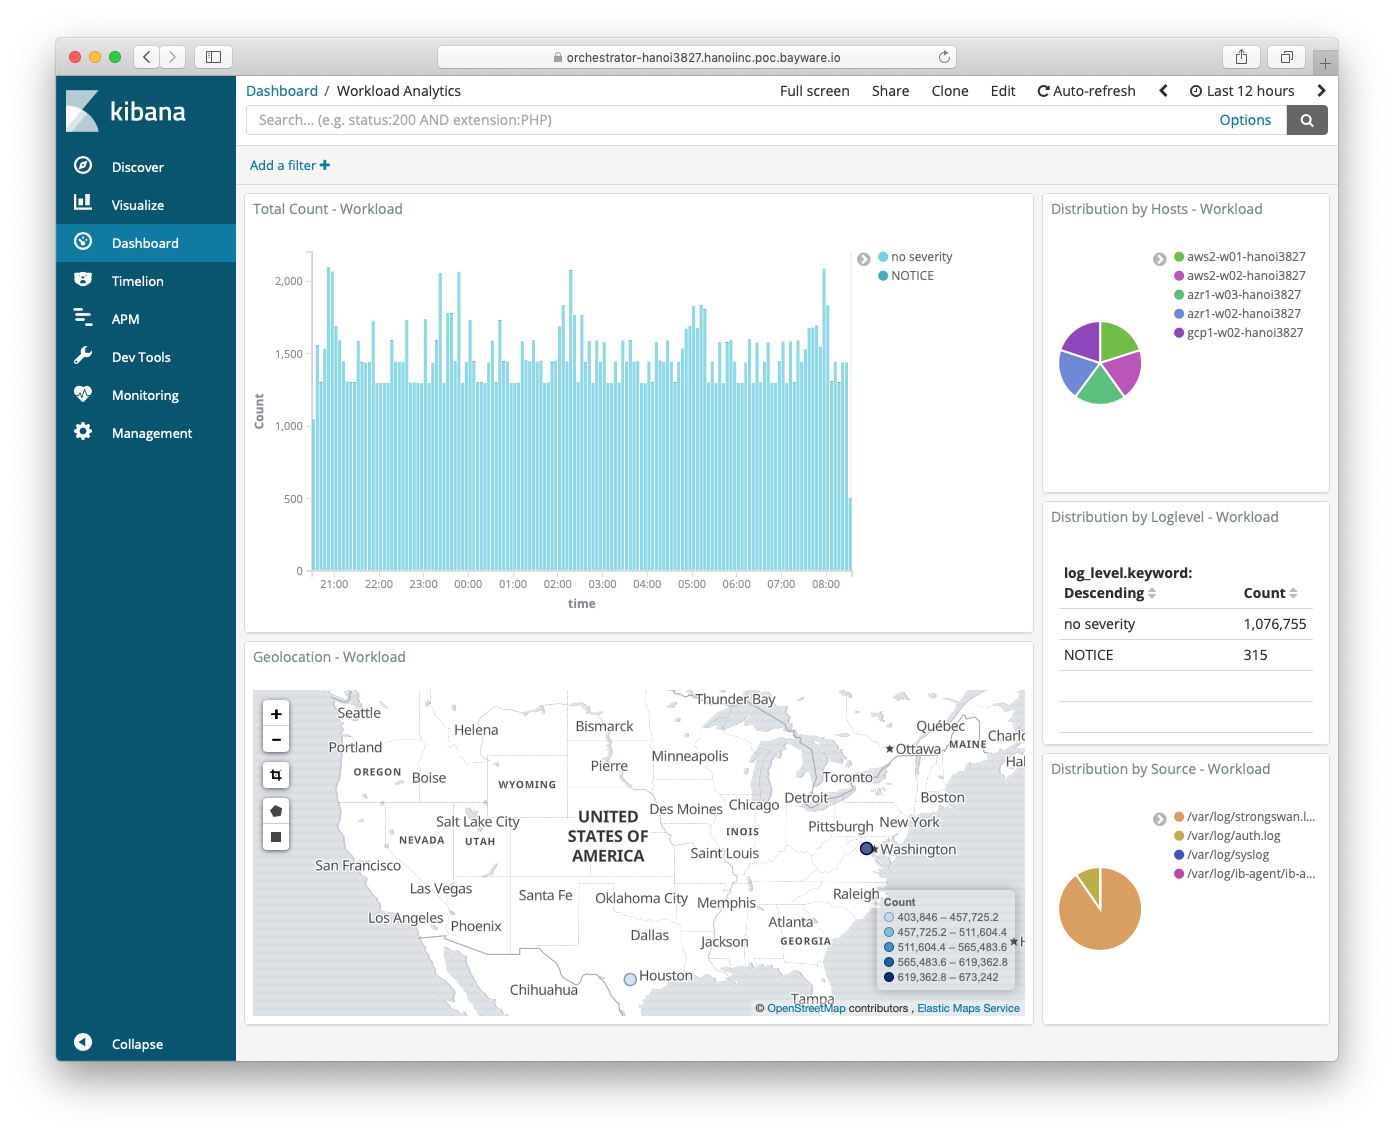
Fig. 110 Events – Workload Analytics
A log shipper on each workload and processor node sends all local log data to the orchestrator in an encrypted mTLS channel. As shown on the SIF Orchestrator Architecture diagram at the beginning of this chapter, the log shipper is part of the fabric logging pipeline that includes Logstash, ElasticSearch, and Kibana. While deploying a new node, the Fabric Manager automatically sets up all stages in this pipeline to collect, transform, store, and visualize events. Also, by default, the Policy Controller pushes all connectivity policy changes to the Events node. As such, every action made either by a fabric administrator or a workload/processor node is documented and available for auditing on the Events node.
Again, the orchestrator events services are available out-of-the-box. Their zero-touch configuration doesn’t require any fabric administrator involvement. Automatic authentication and encryption make the orchestrator events services immediately multicloud-ready. The seamless integration of the orchestrator events services with other fabric components greatly simplifies log data consumption and provides additional level of visibility in application policy, security, and operations.